

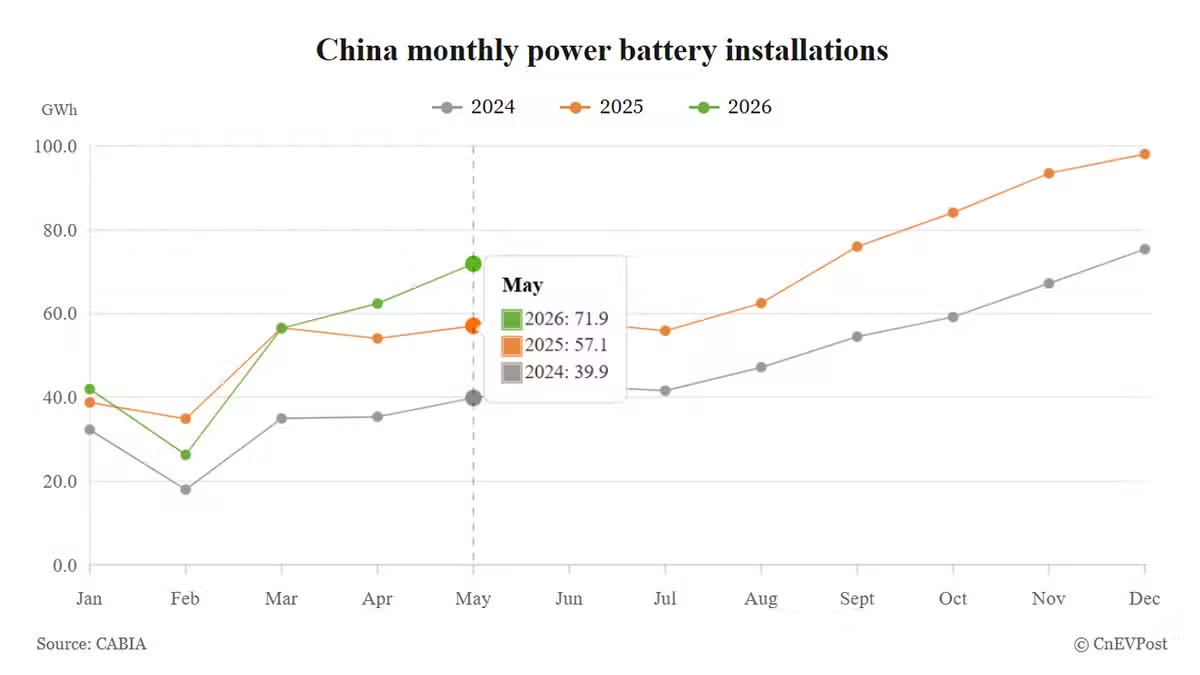
China Monthly Power Battery Installations 2024-2026 (GWh)
Month
2024
2025
2026
January
32.3
38.8
42.0
February
18.0
34.9
26.3
March
35.0
56.6
56.5
April
35.4
54.1
62.4
May
39.9
57.1
71.9
June
42.8
58.2
July
41.6
55.9
August
47.2
62.5
September
54.5
76.0
October
59.2
84.1
November
67.2
93.5
December
75.4
98.1
China monthly power battery installations
2024
2025
2026
- China’s EV battery installations reached 71.9 GWh in May, with LFP batteries taking an 81.2% market share.
- China exported a combined 29.3 GWh of EV and energy-storage batteries in May, up 53.7% year-on-year but down 7.6% from April.
China’s EV battery installations extended their growth momentum last month, expanding for a second consecutive month at a notably faster pace than in April.
EV battery installations totaled 71.9 GWh in May, up 25.9% year-on-year and 15.2% higher than in April, according to data released by the China Automotive Battery Innovation Alliance (CABIA) on Thursday.
The year-on-year growth rate exceeded April’s 15.2%. Prior to that, weighed down by the off-season for auto sales, China’s EV battery installations had fallen 24.64% and 0.18% year-on-year in February and March, respectively.
Lithium iron phosphate (LFP) batteries continued to hold their market dominance, with installations of 58.4 GWh in May, accounting for 81.2% of the domestic market.
China monthly power battery installations: Ternary vs LFP
LFP
Ternary
China Monthly Power Battery Installations: Ternary vs LFP – Monthly Data (GWh)
Month
Ternary (GWh)
LFP (GWh)
Jan 2020
1.6
0.7
Feb 2020
0.5
0.1
Mar 2020
2.2
0.5
Apr 2020
2.6
0.9
May 2020
2.7
0.8
Jun 2020
3.0
1.7
Jul 2020
3.3
1.7
Aug 2020
3.5
1.6
Sep 2020
4.2
2.3
Oct 2020
3.4
2.4
Nov 2020
5.9
4.7
Dec 2020
6.0
6.9
Jan 2021
5.4
3.3
Feb 2021
3.3
2.2
Mar 2021
5.1
3.9
Apr 2021
5.2
3.2
May 2021
5.2
4.5
Jun 2021
5.9
5.1
Jul 2021
5.5
5.8
Aug 2021
5.3
7.2
Sep 2021
6.1
9.5
Oct 2021
7.0
8.4
Nov 2021
9.2
11.6
Dec 2021
11.1
15.1
Jan 2022
7.3
8.9
Feb 2022
5.8
7.8
Mar 2022
8.2
13.2
Apr 2022
4.4
8.9
May 2022
8.3
10.2
Jun 2022
11.6
15.4
Jul 2022
9.8
14.3
Aug 2022
10.5
17.2
Sep 2022
11.2
20.4
Oct 2022
10.8
19.7
Nov 2022
11.0
23.1
Dec 2022
11.4
24.7
Jan 2023
5.4
10.7
Feb 2023
6.7
15.2
Mar 2023
8.7
19.0
Apr 2023
8.0
17.1
May 2023
9.0
19.2
Jun 2023
10.1
22.7
Jul 2023
10.6
21.7
Aug 2023
10.8
24.1
Sep 2023
12.2
24.2
Oct 2023
12.3
26.8
Nov 2023
15.7
29.1
Dec 2023
16.6
31.3
Jan 2024
12.6
19.7
Feb 2024
6.9
11.0
Mar 2024
11.3
23.6
Apr 2024
9.9
25.5
May 2024
10.4
29.5
Jun 2024
11.1
31.7
Jul 2024
11.4
30.1
Aug 2024
12.1
35.0
Sep 2024
13.1
41.3
Oct 2024
12.2
47.0
Nov 2024
13.6
53.6
Dec 2024
14.3
61.0
Jan 2025
8.5
30.2
Feb 2025
6.4
28.4
Mar 2025
10.0
46.6
Apr 2025
9.3
44.8
May 2025
10.5
46.5
Jun 2025
10.7
47.4
Jul 2025
10.9
44.9
Aug 2025
10.9
51.6
Sep 2025
13.8
62.2
Oct 2025
16.5
67.5
Nov 2025
18.2
75.3
Dec 2025
18.2
79.8
Jan 2026
9.4
32.7
Feb 2026
5.7
20.6
Mar 2026
10.7
45.8
Apr 2026
11.5
50.8
May 2026
13.4
58.4
LFP battery installations rose 25.4% year-on-year and 14.9% from April.
Ternary battery installations came in at 13.4 GWh in May, taking an 18.6% share, up 27.3% year-on-year and 15.9% from the previous month.
In the first five months of this year, China’s EV battery installations totaled 259.1 GWh, up 7.3% from the same period in 2025. The cumulative growth rate accelerated from 1.6% in January-April.
LFP battery installations reached 208.2 GWh during the period, accounting for 80.4% of the total, up 6.0% year-on-year.
Ternary battery installations in January-May stood at 50.8 GWh, or 19.6% of the total, up 13.3% year-on-year.
On the sales front, China’s combined sales of EV and energy-storage batteries reached 182.2 GWh in May, up 47.4% year-on-year and 11.0% higher than in April.
Of that, EV battery sales totaled 127.0 GWh in May, accounting for 69.7% of total sales. That was up 45.2% year-on-year and 16.6% from April.
Energy-storage battery sales came in at 55.2 GWh, or 30.3% of total sales, up 52.7% year-on-year but down marginally by 0.1% from April.
Despite still-robust year-on-year growth, battery exports posted a month-on-month decline for a second straight month.
China exported a combined 29.3 GWh of EV and energy-storage batteries in May, accounting for 16.1% of total sales for the month. That was up 53.7% year-on-year but down 7.6% month-on-month. Exports had already fallen 12.3% month-on-month in April.
EV battery exports totaled 20.1 GWh in May, up 48.7% year-on-year but down 0.6% month-on-month.
China Monthly Power Battery Exports 2024-2026 (GWh)
Month
2024
2025
2026
January
8.2
11.1
17.7
February
8.1
12.8
16.9
March
11.9
13.9
22.3
April
9.0
14.5
20.2
May
9.8
13.5
20.1
June
13.2
15.8
July
9.6
14.8
August
11.1
15.1
September
11.8
17.6
October
10.8
19.4
November
12.5
21.2
December
12.9
19.0
China monthly power battery exports
2024
2025
2026
Energy-storage battery exports stood at 9.2 GWh in May, up 66.2% year-on-year but down 19.9% month-on-month.
In January-May, cumulative exports of EV and energy-storage batteries reached 145.1 GWh, up 41.0% year-on-year and accounting for 18.5% of cumulative sales.
EV batteries remained the main driver of exports, with shipments of 97.2 GWh in January-May, accounting for 67.0% of total exports, up 47.8% year-on-year.
Energy-storage battery exports in January-May came in at 47.9 GWh, or 33.0% of total exports, up 29.0% year-on-year.
On the production side, China’s combined output of EV and energy-storage batteries reached 191.7 GWh in May, up 55.2% year-on-year and 4.2% higher than in April.
In January-May, China’s EV and energy-storage battery output totaled 863.0 GWh, up 51.9% year-on-year.
China monthly battery production
China monthly battery production (GWh)Month202420252026Jan65.2107.8168Feb43.6100.3141.6Mar75.8118.3177.7Apr78.2118.2183.9May82.7123.5191.7Jun84.5129.2Jul91.8133.8Aug101.3139.6Sept111.3151.2Oct113.1170.6Nov117.8176.3Dec124.5201.7
Seven Chinese companies rank among the top 10, commanding a combined 72.2% share of the global EV battery market.
