

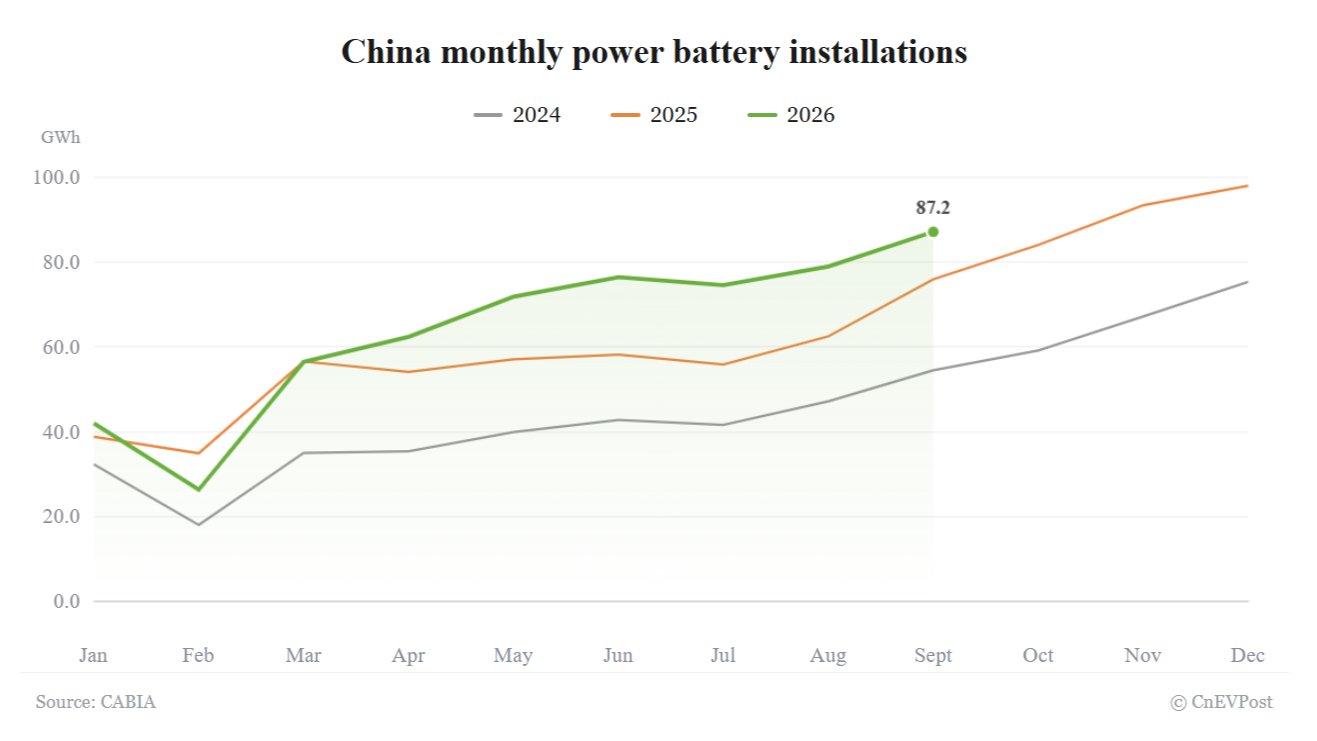
China Monthly Power Battery Installations 2024-2026 (GWh)
Month
2024
2025
2026
January
32.3
38.8
42.0
February
18.0
34.9
26.3
March
35.0
56.6
56.5
April
35.4
54.1
62.4
May
39.9
57.1
71.9
June
42.8
58.2
76.5
July
41.6
55.9
74.6
August
47.2
62.5
79.0
September
54.5
76.0
87.2
October
59.2
84.1
November
67.2
93.5
December
75.4
98.1
China monthly power battery installations
2024
2025
2026
- China’s EV battery installations rose 14.7% year-on-year in September, with growth slowing for the second consecutive month.
- LFP battery installations rose 19.9% year-on-year, accounting for 85.5% of the total, while ternary battery installations fell 10.9%.
China’s EV battery installations reached a fresh high for the year for the second consecutive month in September, but annual growth slowed further, with lithium iron phosphate batteries continuing to drive most of the increase.
Domestic EV battery installations totaled 87.2 GWh in September, up 14.7% year-on-year and 10.4% from August, according to data released Thursday by the China Automotive Battery Innovation Alliance (CABIA).
The figure surpassed August’s 79.0 GWh to set a new monthly high for the year, according to data compiled by CnEVPost.
However, annual growth slowed from 33.5% in July and 26.3% in August to its lowest level since April.
Lithium iron phosphate (LFP) battery installations reached 74.5 GWh in September, up 19.9% year-on-year and 10.3% month-on-month, also marking a high for the year.
China monthly power battery installations: Ternary vs LFP
LFP
Ternary
China Monthly Power Battery Installations: Ternary vs LFP – Monthly Data (GWh)
Month
Ternary (GWh)
LFP (GWh)
Jan 2020
1.6
0.7
Feb 2020
0.5
0.1
Mar 2020
2.2
0.5
Apr 2020
2.6
0.9
May 2020
2.7
0.8
Jun 2020
3.0
1.7
Jul 2020
3.3
1.7
Aug 2020
3.5
1.6
Sep 2020
4.2
2.3
Oct 2020
3.4
2.4
Nov 2020
5.9
4.7
Dec 2020
6.0
6.9
Jan 2021
5.4
3.3
Feb 2021
3.3
2.2
Mar 2021
5.1
3.9
Apr 2021
5.2
3.2
May 2021
5.2
4.5
Jun 2021
5.9
5.1
Jul 2021
5.5
5.8
Aug 2021
5.3
7.2
Sep 2021
6.1
9.5
Oct 2021
7.0
8.4
Nov 2021
9.2
11.6
Dec 2021
11.1
15.1
Jan 2022
7.3
8.9
Feb 2022
5.8
7.8
Mar 2022
8.2
13.2
Apr 2022
4.4
8.9
May 2022
8.3
10.2
Jun 2022
11.6
15.4
Jul 2022
9.8
14.3
Aug 2022
10.5
17.2
Sep 2022
11.2
20.4
Oct 2022
10.8
19.7
Nov 2022
11.0
23.1
Dec 2022
11.4
24.7
Jan 2023
5.4
10.7
Feb 2023
6.7
15.2
Mar 2023
8.7
19.0
Apr 2023
8.0
17.1
May 2023
9.0
19.2
Jun 2023
10.1
22.7
Jul 2023
10.6
21.7
Aug 2023
10.8
24.1
Sep 2023
12.2
24.2
Oct 2023
12.3
26.8
Nov 2023
15.7
29.1
Dec 2023
16.6
31.3
Jan 2024
12.6
19.7
Feb 2024
6.9
11.0
Mar 2024
11.3
23.6
Apr 2024
9.9
25.5
May 2024
10.4
29.5
Jun 2024
11.1
31.7
Jul 2024
11.4
30.1
Aug 2024
12.1
35.0
Sep 2024
13.1
41.3
Oct 2024
12.2
47.0
Nov 2024
13.6
53.6
Dec 2024
14.3
61.0
Jan 2025
8.5
30.2
Feb 2025
6.4
28.4
Mar 2025
10.0
46.6
Apr 2025
9.3
44.8
May 2025
10.5
46.5
Jun 2025
10.7
47.4
Jul 2025
10.9
44.9
Aug 2025
10.9
51.6
Sep 2025
13.8
62.2
Oct 2025
16.5
67.5
Nov 2025
18.2
75.3
Dec 2025
18.2
79.8
Jan 2026
9.4
32.7
Feb 2026
5.7
20.6
Mar 2026
10.7
45.8
Apr 2026
11.5
50.8
May 2026
13.4
58.4
Jun 2026
12.7
63.7
Jul 2026
11.1
63.1
Aug 2026
11.0
67.6
Sep 2026
12.3
74.5
LFP batteries accounted for 85.5% of total installations, slightly below August’s record 85.6%, ending a run of 3 consecutive months of record market share.
Ternary battery installations totaled 12.3 GWh in September, down 10.9% year-on-year but up 11.7% month-on-month, ending 3 consecutive months of sequential declines.
Their share edged up to 14.1% from 14.0% in August, but remained well below the year-earlier level.
In the first 9 months of the year, domestic EV battery installations totaled 576.3 GWh, up 16.7% year-on-year, slightly slower than the 17.0% growth recorded in the first 8 months.
LFP battery installations reached 477.2 GWh over the period, up 18.5% year-on-year and accounting for 82.8% of the total. Ternary battery installations totaled 97.9 GWh, up 7.3%, with a 17.0% share.
CABIA said growth in installations during the first 3 quarters was supported by the expansion of commercial new energy vehicles (NEVs) and higher battery capacity per NEV, with battery-electric trucks and special-purpose vehicles making significant contributions.
Alongside the increase in installations, combined production of power and energy storage batteries reached 237.8 GWh in September, up 57.3% year-on-year and 0.3% month-on-month.
China monthly battery production
China monthly battery production (GWh)Month202420252026Jan65.2107.8168Feb43.6100.3141.6Mar75.8118.3177.7Apr78.2118.2183.9May82.7123.5191.7Jun84.5129.2206Jul91.8133.8218Aug101.3139.6237Sept111.3151.2237.8Oct113.1170.6Nov117.8176.3Dec124.5201.7
China monthly battery production: Ternary vs LFP
LFP
Ternary
China Monthly Power Battery Production: Ternary vs LFP – Monthly Data (GWh)
Month
Ternary (GWh)
LFP (GWh)
Jan 2020
0.37
0.46
Feb 2020
0.50
0.40
Mar 2020
3.20
1.20
Apr 2020
2.90
1.80
May 2020
3.10
2.10
Jun 2020
3.10
2.20
Jul 2020
3.30
2.80
Aug 2020
4.40
3.00
Sep 2020
4.80
3.80
Oct 2020
5.50
4.30
Nov 2020
7.30
5.40
Dec 2020
8.50
6.50
Jan 2021
6.80
5.20
Feb 2021
5.10
4.30
Mar 2021
5.80
5.40
Apr 2021
6.70
6.20
May 2021
5.00
8.80
Jun 2021
7.40
7.80
Jul 2021
8.00
9.30
Aug 2021
8.40
11.10
Sep 2021
9.60
13.50
Oct 2021
9.20
15.90
Nov 2021
10.40
17.80
Dec 2021
11.40
20.10
Jan 2022
10.80
18.80
Feb 2022
11.60
20.10
Mar 2022
15.60
23.60
Apr 2022
10.30
18.60
May 2022
16.30
19.20
Jun 2022
18.30
22.90
Jul 2022
16.60
30.60
Aug 2022
19.30
30.80
Sep 2022
24.30
34.80
Oct 2022
24.20
38.60
Nov 2022
24.20
39.10
Dec 2022
18.50
33.90
Jan 2023
12.42
26.38
Feb 2023
14.57
30.49
Mar 2023
18.20
32.90
Apr 2023
17.60
29.30
May 2023
18.60
37.80
Jun 2023
17.70
42.20
Jul 2023
20.40
40.50
Aug 2023
23.13
50.30
Sep 2023
25.30
51.90
Oct 2023
23.60
53.60
Nov 2023
27.80
59.80
Dec 2023
25.00
52.50
Jan 2024
22.70
42.40
Feb 2024
14.80
28.60
Mar 2024
24.20
51.40
Apr 2024
22.70
55.40
May 2024
22.00
60.50
Jun 2024
20.50
63.80
Jul 2024
23.00
68.50
Aug 2024
24.80
76.30
Sep 2024
27.00
84.20
Oct 2024
23.50
89.50
Nov 2024
24.20
93.40
Dec 2024
26.00
98.10
Jan 2025
20.70
87.00
Feb 2025
19.30
80.90
Mar 2025
23.80
94.30
Apr 2025
23.50
94.60
May 2025
27.20
96.10
Jun 2025
29.50
99.50
Jul 2025
29.50
104.10
Aug 2025
30.90
108.60
Sep 2025
31.50
119.40
Oct 2025
33.70
136.70
Nov 2025
36.40
139.60
Dec 2025
40.60
160.50
Jan 2026
31.30
136.70
Feb 2026
26.90
114.60
Mar 2026
31.30
146.20
Apr 2026
31.60
152.30
May 2026
35.60
155.80
Jun 2026
36.60
169.20
Jul 2026
38.20
179.40
Aug 2026
41.20
195.30
Sep 2026
35.00
202.40
Combined sales of the 2 battery categories totaled 222.7 GWh, up 52.0% year-on-year but down 0.2% from August. Sales growth for energy storage batteries continued to significantly outpace that of power batteries.
Power battery sales reached 149.2 GWh, up 35.0% year-on-year, while energy storage battery sales rose 104.4% to 73.5 GWh, accounting for 33.0% of total sales.
Combined exports of power and energy storage batteries totaled 44.0 GWh in September, up 64.5% year-on-year and 3.7% month-on-month, equivalent to 19.7% of sales.
China Monthly Power Battery and Energy Storage Battery Exports 2024-2026 (GWh)
Month
2024
2025
2026
January
8.4
17.5
24.1
February
8.2
21.1
23.9
March
12.2
23.0
36.1
April
12.7
22.3
31.7
May
13.8
19.0
29.3
June
18.4
24.4
36.2
July
15.6
23.2
35.2
August
16.7
22.6
42.4
September
20.2
26.7
44.0
October
19.9
28.2
November
21.9
32.2
December
21.9
32.6
China monthly power battery and energy storage battery exports
2024
2025
2026
Power battery exports reached 28.4 GWh, up 60.9% year-on-year and 14.9% month-on-month. Energy storage battery exports totaled 15.6 GWh, up 71.4% year-on-year but down 11.9% from August.
China Monthly Power Battery Exports 2024-2026 (GWh)
Month
2024
2025
2026
January
8.2
11.1
17.7
February
8.1
12.8
16.9
March
11.9
13.9
22.3
April
9.0
14.5
20.2
May
9.8
13.5
20.1
June
13.2
15.8
25.5
July
9.6
14.8
24.0
August
11.1
15.1
24.7
September
11.8
17.6
28.4
October
10.8
19.4
November
12.5
21.2
December
12.9
19.0
China monthly power battery exports
2024
2025
2026
China monthly battery exports: Ternary vs LFP
LFP
Ternary
China Monthly Power Battery Exports: Ternary vs LFP – Monthly Data (GWh)
Month
Ternary (GWh)
LFP (GWh)
Jan 2023
5.4
2.6
Feb 2023
6.6
2.8
Mar 2023
6.8
2.0
Apr 2023
6.5
2.3
May 2023
7.6
3.7
Jun 2023
6.6
3.3
Jul 2023
7.2
3.9
Aug 2023
6.8
3.7
Sep 2023
8.3
2.5
Oct 2023
7.4
4.0
Nov 2023
8.2
4.7
Dec 2023
9.6
4.3
Jan 2024
3.9
4.2
Feb 2024
4.7
3.3
Mar 2024
6.1
5.6
Apr 2024
6.3
2.6
May 2024
6.3
3.4
Jun 2024
8.3
4.8
Jul 2024
5.9
3.5
Aug 2024
7.7
3.3
Sep 2024
8.2
3.4
Oct 2024
7.3
3.4
Nov 2024
8.5
3.9
Dec 2024
7.7
5.0
Jan 2025
6.8
4.3
Feb 2025
7.5
5.3
Mar 2025
8.8
5.0
Apr 2025
8.7
5.6
May 2025
7.2
6.2
Jun 2025
9.0
6.8
Jul 2025
8.4
6.2
Aug 2025
8.7
6.3
Sep 2025
10.7
6.8
Oct 2025
11.5
7.9
Nov 2025
11.7
9.4
Dec 2025
9.2
9.8
Jan 2026
9.7
8.0
Feb 2026
9.2
7.6
Mar 2026
11.3
10.8
Apr 2026
9.4
10.7
May 2026
8.6
11.4
Jun 2026
11.5
13.9
Jul 2026
9.3
14.6
Aug 2026
10.3
14.3
Sep 2026
13.3
15.0
China Monthly Energy Storage Battery Exports 2024-2026 (GWh)
Month
2024
2025
2026
January
0.2
6.3
6.4
February
0.1
8.3
7.0
March
0.4
9.1
13.8
April
3.7
7.9
11.4
May
4.0
5.5
9.2
June
5.3
8.5
10.7
July
6.0
8.4
11.3
August
5.6
7.6
17.7
September
8.4
9.1
15.6
October
9.0
8.8
November
9.4
10.9
December
8.9
13.6
China monthly energy storage battery exports
2024
2025
2026
In the first 9 months, combined exports of the 2 categories reached 302.9 GWh, up 51.6% year-on-year. Power battery exports rose 54.7% to 199.7 GWh, while energy storage battery exports increased 45.9% to 103.2 GWh.
CABIA said power battery exports grew faster than energy storage battery exports in the first 3 quarters, mainly driven by rising vehicle exports and automakers’ overseas factories gradually starting production.
The 7 Chinese companies in the top 10 held a combined 73.3% share of the global EV battery market.
