

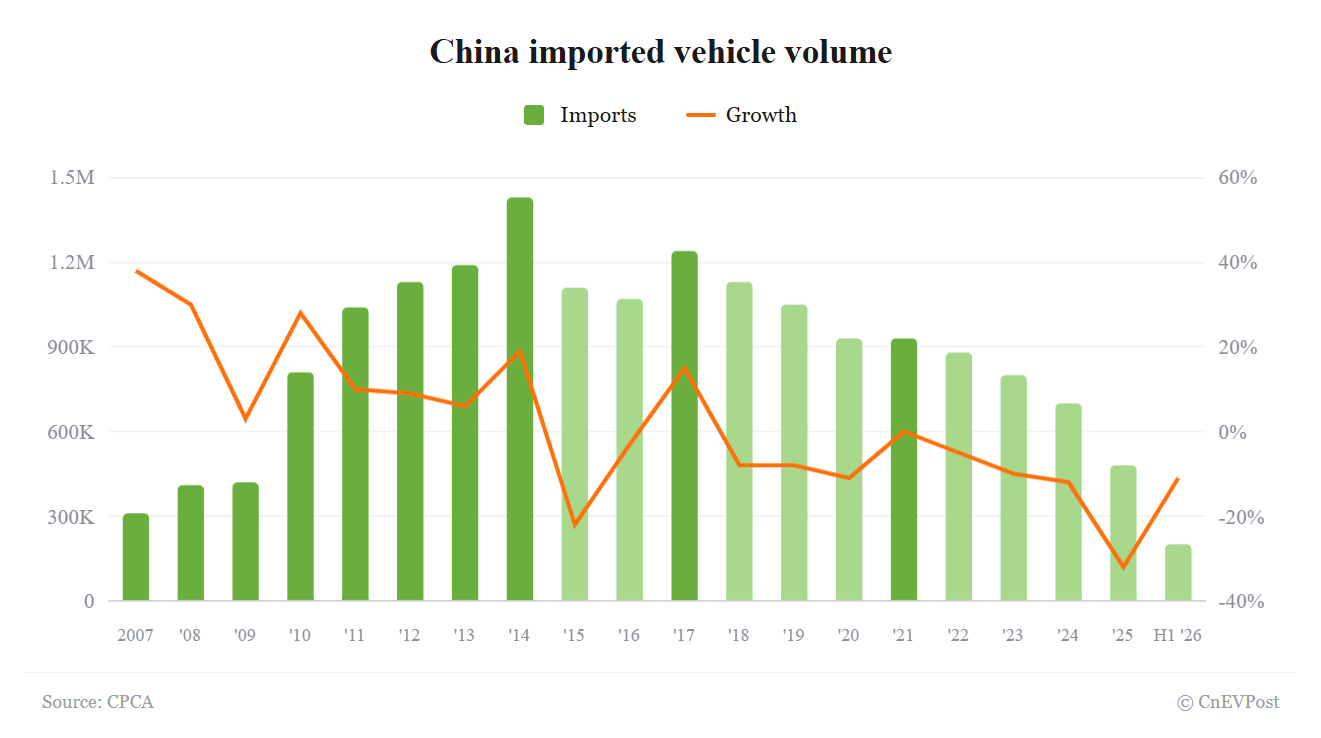
China Imported Vehicle Volume 2007-H1 2026
Year
Imports
Growth
2007
310,000
38.0%
2008
410,000
30.0%
2009
420,000
3.0%
2010
810,000
28.0%
2011
1,040,000
10.0%
2012
1,130,000
9.0%
2013
1,190,000
6.0%
2014
1,430,000
19.0%
2015
1,110,000
-22.0%
2016
1,070,000
-3.0%
2017
1,240,000
15.0%
2018
1,130,000
-8.0%
2019
1,050,000
-8.0%
2020
930,000
-11.0%
2021
930,000
0.0%
2022
880,000
-5.0%
2023
800,000
-10.0%
2024
700,000
-12.0%
2025
480,000
-32.0%
H1 2026
200,000
-11.0%
China imported vehicle volume
Imports
Growth
- Retail sales of imported cars fell 29% year-on-year to 190,000 units in the first half.
- Japan and Germany held steady, while NEVs slipped to 2% of imports as gasoline cars regained dominance.
China imported 200,000 vehicles in the first six months of 2026, down 11% year-on-year, according to data released Sunday by the China Passenger Car Association (CPCA).
The decline was far smaller than in previous years, but that owed largely to the low base of late 2025 rather than any genuine recovery in demand.
June imports came to 38,000 units, down 11% from a year earlier. The war between the US and Iran disrupted shipping in March and April, causing a sharp drop in imports at the time. The CPCA said the first-half performance was relatively strong by recent standards.
Weakness in demand was more evident. Retail sales of imported cars fell 29% to 190,000 units in the first half, and dropped to 30,000 units in June, a steeper 39% decline. The CPCA warned that pressure will remain significant.
China’s vehicle imports peaked at 1.43 million units in 2014 and have been falling since.
Imports totaled 700,000 units in 2024, down 12%, before shrinking further to 480,000 units in 2025, a 32% decline. Smoothing out the volatility, imports have now fallen for eight consecutive years, the CPCA said.
The rise of local brands and the accelerating localization of international automakers are the main reasons behind the sustained contraction.
By country, Japan remained the top source with 103,493 units, up 20,095 from a year earlier. Germany accounted for 44,311 units, the US 17,732, Slovakia 13,520 and the UK 10,855.
Japan, Thailand, Austria and Mexico posted the biggest gains, while Slovakia saw the largest loss.
Imports are reverting to a traditional gasoline-vehicle mix. Imported battery electric passenger cars fell 36% in the first half, while plug-in hybrids dropped 58%. NEVs accounted for 2% of imported passenger cars, down from 3% in 2024.
German NEV imports performed poorly and NEV imports from the US had virtually no sales, the CPCA noted.
By engine size, gasoline models under 2 liters made up 64% of total imports, up 4 percentage points from last year. Larger 3- to 4-liter models declined more slowly, as they face less competition in the domestic market.
The luxury segment showed a mixed picture. Lexus remained the top imported luxury brand, with insurance-registered retail sales of 184,000 units in 2025, up 2%, and first-half 2026 volumes still near the highs of the past four years. Mercedes-Benz and Land Rover held up relatively well.
Super-luxury brands, however, showed signs of collapse. Bentley and Rolls-Royce were sluggish, Maserati pulled back after an unusually strong 2025, and Ferrari proved comparatively resilient.
The CPCA said purchasing power among ultra-high-end consumers has slowed for now, with recent sell-offs putting pressure on pricing.
Regionally, luxury car markets in traditionally affluent areas such as Shanghai, Beijing, Hangzhou, Chengdu and Wuxi are under pressure. Tianjin remained the top market for super-luxury cars, while Beijing has declined sharply of late.
China’s NEV retail penetration held at a high 62.8% in June as gasoline vehicles continued to collapse.
