

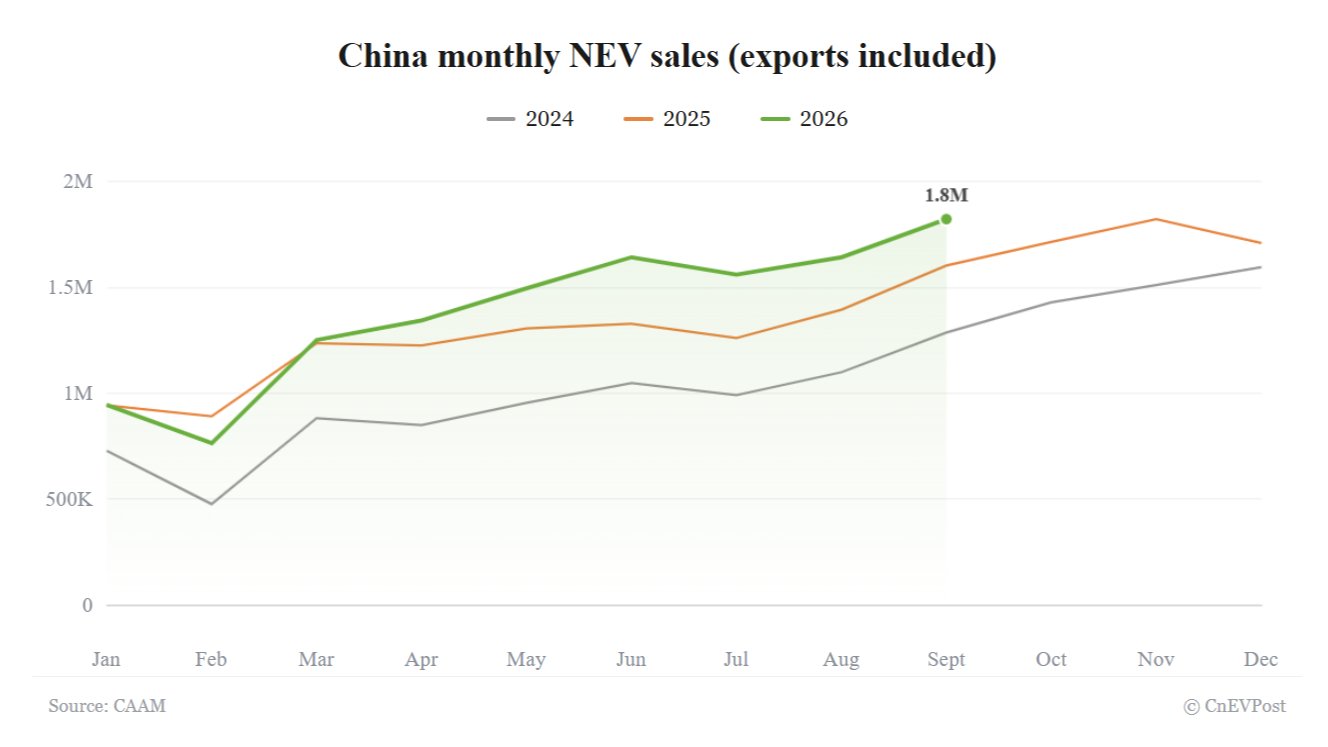
China Monthly NEV Sales (Exports Included) 2024-2026
Month
2024
2025
2026
January
729,000
944,000
945,000
February
477,000
892,000
765,000
March
883,000
1,237,000
1,252,000
April
850,000
1,226,000
1,344,000
May
955,000
1,307,000
1,496,000
June
1,049,000
1,329,000
1,643,000
July
991,000
1,262,000
1,561,000
August
1,100,000
1,395,000
1,643,000
September
1,287,000
1,604,000
1,823,000
October
1,430,000
1,715,000
November
1,512,000
1,823,000
December
1,596,000
1,710,000
China monthly NEV sales (exports included)
2024
2025
2026
- China’s NEV sales rose 13.6% year-on-year to 1.823 million in September, with BEV sales reaching a record 1.277 million.
- NEV exports surged 160% year-on-year, while domestic sales fell 9.4%.
China’s new energy vehicle (NEV) sales rose 13.6% year-on-year in September, as strong exports continued to offset weakness in the domestic market.
NEV sales, including domestic sales and exports, reached 1.823 million units in September, the highest monthly total this year, according to data released by the China Association of Automobile Manufacturers (CAAM) on Monday.
That was up 11.0% from August’s 1.643 million units, though year-on-year growth slowed from 17.8%, according to data compiled by CnEVPost.
NEVs accounted for 61.6% of total vehicle sales, up from 60.6% in August and remaining above 60% for a third consecutive month.
China Monthly NEV Penetration 2024-2026
Month
2024
2025
2026
January
29.9%
39%
40.3%
February
30.1%
41.9%
42.4%
March
32.8%
42.4%
43.2%
April
36%
47.3%
53.2%
May
39.5%
48.7%
56.9%
June
41.1%
45.8%
58.5%
July
43.8%
48.7%
60.4%
August
44.8%
48.8%
60.6%
September
45.8%
49%
61.6%
October
46.8%
51.6%
November
45.6%
53.2%
December
45.7%
52.3%
China monthly NEV penetration
2024
2025
2026
CAAM’s NEV figures cover both passenger and commercial vehicles, including battery electric vehicles (BEVs), plug-in hybrid electric vehicles (PHEVs) and fuel cell vehicles.
BEVs remained the main driver of growth. September BEV sales reached a record 1.277 million units, up 20.7% year-on-year and 10.0% from August.
China Monthly BEV Sales 2024-2026
Month
2024
2025
2026
January
445,000
574,000
597,000
February
294,000
544,000
484,000
March
566,000
806,000
831,000
April
519,000
822,000
905,000
May
583,000
834,000
1,026,000
June
612,000
859,000
1,142,000
July
551,000
811,000
1,072,000
August
646,000
908,000
1,161,000
September
775,000
1,058,000
1,277,000
October
842,000
1,109,000
November
908,000
1,170,000
December
973,000
1,108,000
China monthly BEV sales
2024
2025
2026
PHEV sales totaled 546,000 units, unchanged from a year earlier and up 13.3% from August.
China Monthly PHEV Sales 2024-2026
Month
2024
2025
2026
January
284,000
370,000
348,000
February
183,000
348,000
280,000
March
317,000
431,000
421,000
April
331,000
403,000
439,000
May
371,000
473,000
470,000
June
436,000
470,000
500,000
July
438,000
451,000
489,000
August
453,000
487,000
482,000
September
511,000
546,000
546,000
October
587,000
605,000
November
604,000
652,000
December
622,000
599,000
China monthly PHEV sales
2024
2025
2026
NEV sales in the first 9 months totaled 12.47 million units, up 11.1% year-on-year and accounting for 53.6% of total vehicle sales.
Exports were the key source of growth. NEV exports reached 571,000 units in September, up 160% year-on-year and 8.6% from August.
China Monthly NEV Exports 2024-2026
Month
2024
2025
2026
January
101,000
150,000
302,000
February
82,000
131,000
282,000
March
124,000
158,000
371,000
April
114,000
200,000
430,000
May
99,000
212,000
446,000
June
86,000
205,000
523,000
July
103,000
225,000
553,000
August
110,000
224,000
526,000
September
111,000
222,000
571,000
October
128,000
256,000
November
83,000
300,000
December
134,000
300,000
China monthly NEV exports
2024
2025
2026
That included 352,000 BEVs, up 130% year-on-year, and 219,000 PHEVs, up 220%.
Exports of conventional fuel vehicles rose 12% year-on-year to 482,000 units in September. Based on those figures, NEVs accounted for about 54% of total vehicle exports, exceeding half for a fourth consecutive month.
NEV exports in the first 9 months totaled 4.006 million units, up 130% year-on-year.
The domestic market continued to contract. Domestic NEV sales fell 9.4% year-on-year to 1.252 million units in September, though they rose 12% from August. Sales in the first 9 months totaled 8.466 million units, down 10.6% year-on-year.
China Monthly NEV Sales (Excluding Exports) 2024-2026
Month
2024
2025
2026
January
629,000
793,000
643,000
February
395,000
760,000
483,000
March
758,000
1,079,000
882,000
April
736,000
1,025,000
914,000
May
856,000
1,095,000
1,049,000
June
963,000
1,124,000
1,120,000
July
887,000
1,037,000
1,008,000
August
990,000
1,171,000
1,118,000
September
1,176,000
1,382,000
1,252,000
October
1,302,000
1,459,000
November
1,429,000
1,522,000
December
1,463,000
1,410,000
China NEV sales excluding exports
2024
2025
2026
Domestic passenger NEV sales fell 12.1% year-on-year to 1.142 million units in September, while commercial NEV sales rose 32.6% to 110,000 units.
Despite the decline in domestic sales, NEVs’ share of the domestic vehicle market rose to 65.8%. Their share of the domestic passenger vehicle market reached 68.5%.
That reflected a sharp contraction in demand for conventional fuel vehicles. Domestic sales of conventional fuel passenger vehicles fell 47.3% year-on-year to 526,000 units in September, a drop of 473,000 units from a year earlier.
Total passenger vehicle sales came in at 2.588 million units in September, down 9.5% year-on-year but up 8.6% from August. Domestic sales fell 27.4% year-on-year to 1.668 million units, while exports rose 64.2% to 919,000 units.
China Monthly Car Sales 2024-2026
Month
2024
2025
2026
January
2,439,000
2,423,000
2,346,000
February
1,584,000
2,129,000
1,805,000
March
2,694,000
2,915,000
2,899,000
April
2,359,000
2,590,000
2,526,000
May
2,417,000
2,686,000
2,629,000
June
2,552,000
2,904,000
2,810,000
July
2,262,000
2,593,000
2,584,000
August
2,453,000
2,857,000
2,712,000
September
2,809,000
3,276,000
2,956,000
October
3,053,000
3,322,000
November
3,316,000
3,429,000
December
3,489,000
3,272,000
China monthly car sales
2024
2025
2026
Passenger vehicle sales in the first 9 months totaled 19.96 million units, down 6.1% year-on-year. Passenger vehicle exports over the same period rose 70.6% to 7.167 million units.
China’s vehicle production and sales edged lower in the first 3 quarters, with weak domestic demand contrasting with booming overseas sales, CAAM said. Multiple factors continued to weigh on the domestic market, with no meaningful improvement so far.
Despite a challenging external environment, exports maintained rapid growth and showed strong resilience, CAAM said.
China’s NEV retail sales totaled 1.084 million in September, down 16.7% year-on-year for a ninth consecutive monthly decline.
