

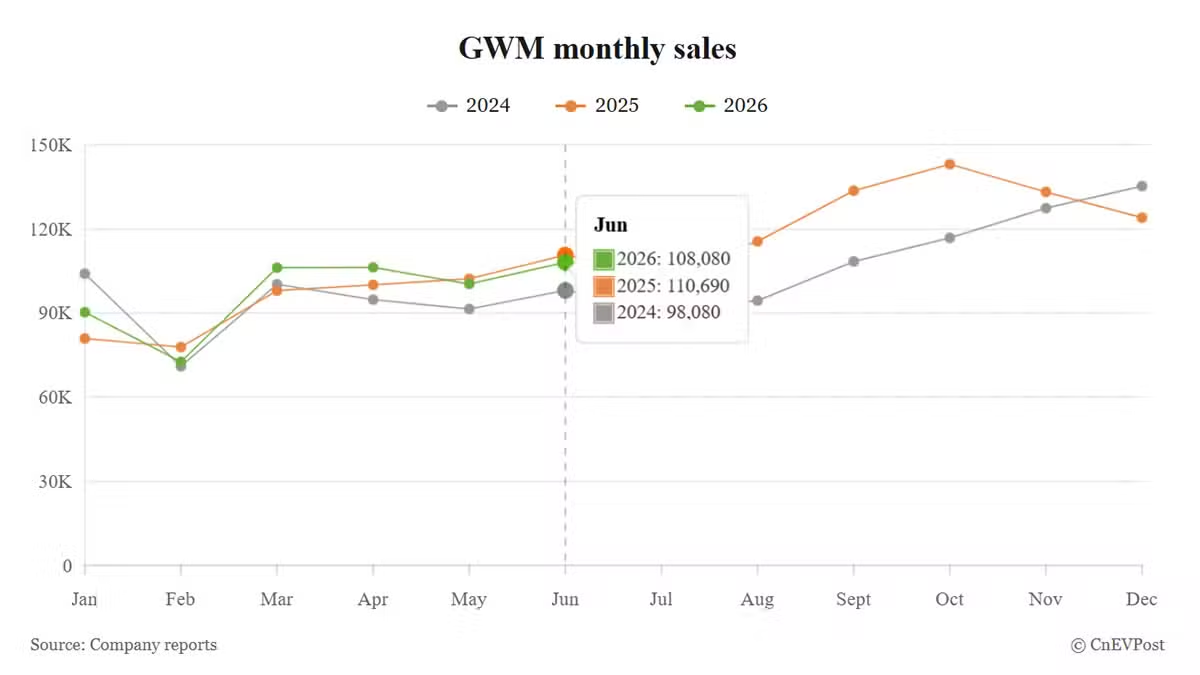
GWM Monthly Sales 2024-2026
Month
2024
2025
2026
January
104,030
80,933
90,312
February
71,027
77,883
72,594
March
100,276
97,991
106,198
April
94,796
100,061
106,312
May
91,460
102,231
100,399
June
98,080
110,690
108,080
July
91,285
104,372
August
94,461
115,558
September
108,398
133,639
October
116,799
143,078
November
127,394
133,216
December
135,286
124,020
GWM monthly sales
2024
2025
2026
- GWM’s global sales fell 2.36% year-on-year to 108,080 units in June, with overseas markets contributing 56%.
- GWM sold 34,659 NEVs in June, down 4.80% year-on-year but up 13.83% from the previous month.
GWM (HKEX: 2333) saw a slight decline in overall sales in June, with the continued strong performance of overseas markets easing the pressure from weak domestic demand.
The Chinese automaker sold 108,080 vehicles in June, down 2.36% from a year earlier. The figure, however, rose 7.65% from May.
Looking at the cumulative data for the first half of this year, GWM maintained its growth momentum. From January to June, the company sold 583,895 vehicles, up 2.48% year-on-year.
Overseas markets remained GWM’s most important growth engine. In June, overseas sales accounted for 55.67% of total sales.
GWM sold 60,168 vehicles in overseas markets in June, a sharp increase of 50.16% year-on-year and up 18.70% from the previous month.
From January to June, the company’s cumulative overseas sales reached 291,426 units, up 47.44% year-on-year. This figure accounted for 49.91% of total sales in the first half.
GWM Monthly Overseas Sales 2024-2026
Month
2024
2025
2026
January
26,374
28,016
40,278
February
30,589
31,068
42,675
March
35,815
31,806
47,142
April
36,141
32,165
50,475
May
34,477
34,535
50,688
June
38,104
40,068
60,168
July
38,185
41,088
August
40,454
45,166
September
44,105
50,269
October
44,418
57,158
November
43,186
57,309
December
41,293
57,418
GWM monthly overseas sales
2024
2025
2026
In sharp contrast to the strong overseas momentum, GWM continued to face pressure in its home market in China. The company sold 47,912 vehicles domestically in June, down 32.16% year-on-year and down 3.62% from May.
From January to June, the company’s cumulative domestic sales stood at 292,469 units, down 21.41% year-on-year.
GWM Monthly Domestic Sales in China 2024-2026
Month
2024
2025
2026
January
77,656
52,917
50,034
February
40,438
46,815
29,919
March
64,461
66,185
59,056
April
58,655
67,896
55,837
May
56,983
67,696
49,711
June
59,976
70,622
47,912
July
53,100
63,284
August
54,007
70,392
September
64,293
83,370
October
72,381
85,920
November
84,208
75,907
December
93,993
66,602
GWM monthly domestic sales in China
2024
2025
2026
In the new energy vehicle (NEV) segment, GWM delivered mixed results in June. It sold 34,659 NEVs in June, down 4.80% year-on-year but up 13.83% from May.
Looking at the cumulative data for the first half, GWM sold 144,634 NEVs, down 9.84% year-on-year. NEVs accounted for 32.07% of sales in June.
GWM Monthly NEV Sales 2024-2026
Month
2024
2025
2026
January
25,030
22,263
18,029
February
12,270
15,121
12,744
March
21,882
25,174
21,857
April
22,436
28,813
26,898
May
24,649
32,638
30,447
June
26,107
36,405
34,659
July
24,145
34,593
August
24,844
37,495
September
30,129
45,961
October
32,039
46,155
November
35,999
40,113
December
42,265
38,922
GWM monthly NEV sales
2024
2025
2026
By brand, the core Haval brand remained the sales mainstay.
The Haval brand sold 60,288 vehicles in June, down 3.38% year-on-year but up 8.67% from the previous month.
Haval’s cumulative sales from January to June reached 327,290 units, up a modest 1.82% year-on-year.
GWM Haval Monthly Sales 2024-2026
Month
2024
2025
2026
January
59,103
48,557
50,513
February
44,731
43,301
43,660
March
54,055
52,732
57,021
April
47,054
56,748
60,330
May
47,066
57,693
55,478
June
47,729
62,396
60,288
July
52,944
56,221
August
56,166
68,912
September
62,900
81,923
October
72,675
88,235
November
78,386
75,383
December
83,425
66,453
GWM Haval monthly sales
2024
2025
2026
The Tank brand, which focuses on the off-road market, faced clear downward pressure. The brand sold 15,713 vehicles in June, down 27.16% year-on-year and down 7.93% from the previous month.
Tank’s cumulative sales in the first half stood at 92,653 units, down 10.62% year-on-year.
GWM Tank Monthly Sales 2024-2026
Month
2024
2025
2026
January
20,067
12,845
14,505
February
10,164
11,762
10,036
March
18,953
17,381
18,316
April
20,469
19,201
17,016
May
20,326
20,900
17,067
June
26,059
21,571
15,713
July
18,682
20,020
August
16,350
20,022
September
18,740
21,441
October
19,123
22,306
November
20,189
24,135
December
21,879
21,129
GWM Tank monthly sales
2024
2025
2026
The premium Wey brand also declined in June. The brand sold 7,191 vehicles during the month, down 29.48% year-on-year and down 11.43% from the previous month.
Despite the weak monthly performance, Wey’s cumulative sales from January to June reached 44,514 units, still up 29.05% year-on-year.
GWM Wey Monthly Sales 2024-2026
Month
2024
2025
2026
January
3,351
5,007
7,873
February
2,649
3,643
5,615
March
3,608
4,675
7,751
April
4,458
4,811
7,965
May
2,862
6,161
8,119
June
2,939
10,197
7,191
July
2,765
10,045
August
3,001
8,028
September
6,755
11,026
October
6,486
12,699
November
7,046
12,763
December
8,808
12,899
GWM Wey monthly sales
2024
2025
2026
In addition, GWM’s pickup trucks sold 14,012 units in June, up 6.05% year-on-year and up 2.82% from the previous month.
GWM’s pickup trucks recorded cumulative sales of 92,512 units in the first half of this year, down 5.44% year-on-year.
GWM Pickup Truck Monthly Sales 2024-2026
Month
2024
2025
2026
January
15,466
12,321
15,350
February
10,460
17,263
12,011
March
17,569
20,421
20,450
April
18,069
17,500
17,061
May
15,101
15,510
13,628
June
15,251
13,213
14,012
July
12,028
13,772
August
13,718
13,322
September
14,456
12,901
October
12,888
14,088
November
15,853
16,011
December
16,241
15,338
GWM pickup truck monthly sales
2024
2025
2026
GWM H10 is a boxy large SUV with up to 180 kilometers of pure-electric range.
