

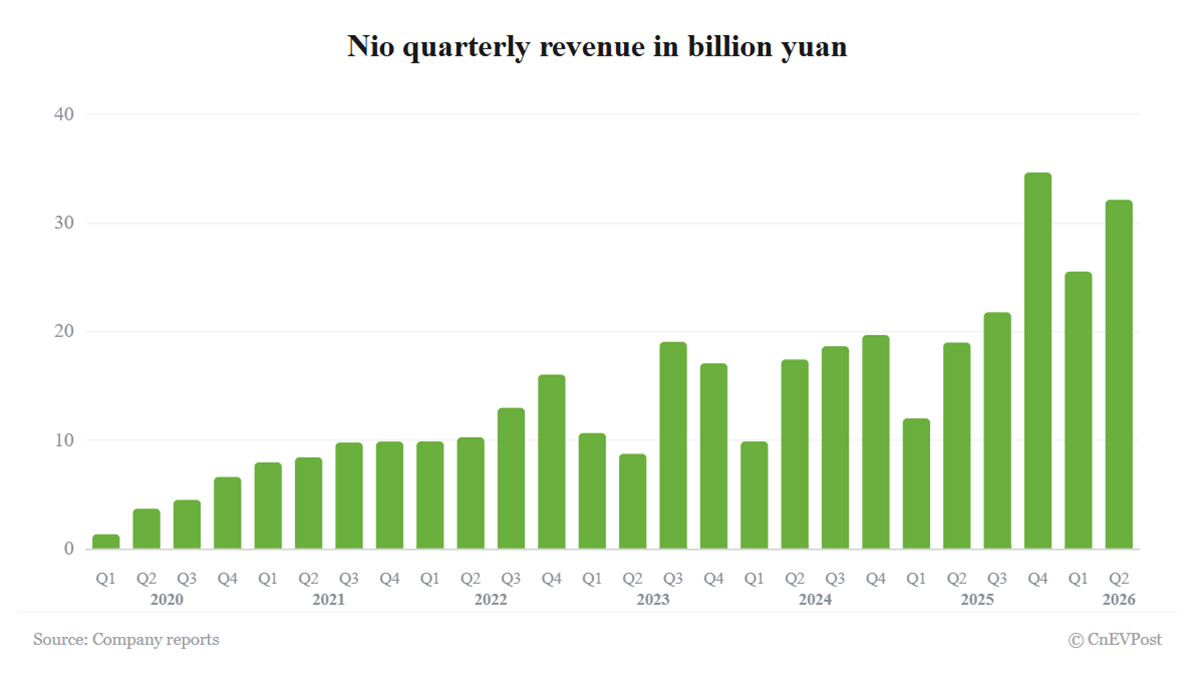
Nio Inc Quarterly Revenue Q1 2020-Q2 2026 (in billion yuan)
Quarter
Revenue (RMB bn)
Q1 2020
1.37
Q2 2020
3.72
Q3 2020
4.53
Q4 2020
6.64
Q1 2021
7.98
Q2 2021
8.45
Q3 2021
9.81
Q4 2021
9.90
Q1 2022
9.91
Q2 2022
10.29
Q3 2022
13.00
Q4 2022
16.06
Q1 2023
10.68
Q2 2023
8.77
Q3 2023
19.07
Q4 2023
17.10
Q1 2024
9.91
Q2 2024
17.45
Q3 2024
18.67
Q4 2024
19.70
Q1 2025
12.03
Q2 2025
19.01
Q3 2025
21.79
Q4 2025
34.65
Q1 2026
25.53
Q2 2026
32.14
Nio quarterly revenue in billion yuan
- Nio recorded adjusted profit from operations of 206.9 million yuan in the second quarter, about 3.1 times the first-quarter figure.
- Its GAAP net loss widened to 528 million yuan.
Nio Inc (NYSE: NIO) posted an adjusted operating profit for a third consecutive quarter, as sales of higher-priced models helped strengthen its financial position.
The company’s second-quarter revenue rose 69.1% year-on-year to 32.14 billion yuan ($4.74 billion), driven by higher deliveries and an improved product mix, according to its earnings report released Tuesday (September 1).
Revenue increased 25.9% from the first quarter, but was still about 2% below the lower end of the company’s previous guidance of 32.78 billion yuan.
Nio recorded adjusted profit from operations of 206.9 million yuan in the second quarter, marking the third consecutive quarter in which the metric remained positive.
The figure was about 3.1 times the 66.8 million yuan recorded in the first quarter. By comparison, the company posted an adjusted operating loss of 4.04 billion yuan in the same period last year.
Excluding share-based compensation expenses, Nio recorded an adjusted net profit (non-GAAP) of 26.1 million yuan in the second quarter, down from 43.5 million yuan in the first quarter.
Nio Inc Quarterly Adjusted Net Income Q1 2020-Q2 2026 (in million yuan)
Quarter
Adjusted Net Income (RMB mn)
Q1 2020
-1,659
Q2 2020
-1,131
Q3 2020
-998
Q4 2020
-1,328
Q1 2021
-355
Q2 2021
-336
Q3 2021
-570
Q4 2021
-1,747
Q1 2022
-1,310
Q2 2022
-2,267
Q3 2022
-3,499
Q4 2022
-5,066
Q1 2023
-4,150
Q2 2023
-5,446
Q3 2023
-3,953
Q4 2023
-4,802
Q1 2024
-4,903
Q2 2024
-4,535
Q3 2024
-4,413
Q4 2024
-6,622
Q1 2025
-6,279
Q2 2025
-4,127
Q3 2025
-2,735
Q4 2025
-727
Q1 2026
44
Q2 2026
26
Nio quarterly adjusted net income in million yuan
On a GAAP basis, the company’s second-quarter net loss was 528 million yuan, sharply narrower than 4.9948 billion yuan a year earlier but 59% wider than 332.1 million yuan in the first quarter.
Nio Inc Quarterly Net Income Q1 2020-Q2 2026 (in million yuan)
Quarter
Net Income (RMB mn)
Q1 2020
-1,692
Q2 2020
-1,177
Q3 2020
-1,047
Q4 2020
-1,389
Q1 2021
-451
Q2 2021
-587
Q3 2021
-835
Q4 2021
-2,143
Q1 2022
-1,783
Q2 2022
-2,758
Q3 2022
-4,111
Q4 2022
-5,786
Q1 2023
-4,740
Q2 2023
-6,056
Q3 2023
-4,557
Q4 2023
-5,368
Q1 2024
-5,185
Q2 2024
-5,046
Q3 2024
-5,060
Q4 2024
-7,111
Q1 2025
-6,750
Q2 2025
-4,995
Q3 2025
-3,480
Q4 2025
283
Q1 2026
-332
Q2 2026
-528
Nio quarterly net income in million yuan
Vehicle sales rose 80.1% year-on-year and 27.5% sequentially to 29.0582 billion yuan in the second quarter. Nio attributed the growth to higher delivery volume and an increase in average selling prices resulting from changes in its product mix.
The company delivered 107,658 vehicles during the quarter, up 49.4% year-on-year but below its previous guidance range of 110,000 to 115,000 units.
Nio’s overall gross margin was 18.4% in the second quarter, up from 10.0% a year earlier but slightly below the first quarter’s 4-year high of 19.0%.
Vehicle margin rose to 18.5% from 10.3% a year earlier and was broadly stable compared with 18.8% in the first quarter. Higher sales of high-margin models and cost-structure optimization supported margins.
Nio Inc Quarterly Margins Q1 2020-Q2 2026
Quarter
Gross Margin
Vehicle Margin
Q1 2020
-12.2%
-7.4%
Q2 2020
8.4%
9.7%
Q3 2020
12.9%
14.5%
Q4 2020
17.2%
17.2%
Q1 2021
19.5%
21.2%
Q2 2021
18.6%
20.3%
Q3 2021
20.3%
18.0%
Q4 2021
17.2%
20.9%
Q1 2022
14.6%
18.1%
Q2 2022
13.0%
16.7%
Q3 2022
13.3%
16.4%
Q4 2022
3.9%
6.8%
Q1 2023
1.5%
5.1%
Q2 2023
1.0%
6.2%
Q3 2023
8.0%
11.0%
Q4 2023
7.5%
11.9%
Q1 2024
4.9%
9.2%
Q2 2024
9.7%
12.2%
Q3 2024
10.7%
13.1%
Q4 2024
11.7%
13.1%
Q1 2025
7.6%
10.2%
Q2 2025
10.0%
10.3%
Q3 2025
13.9%
14.7%
Q4 2025
17.5%
18.1%
Q1 2026
19.0%
18.8%
Q2 2026
18.4%
18.5%
Nio quarterly margins
Gross margin
Vehicle margin
Research and development expenses fell 28.7% year-on-year to 2.14 billion yuan in the second quarter, but rose 13.8% sequentially, mainly due to increased investment in developing new products and technologies.
Selling, general and administrative expenses rose 11.6% year-on-year and 26.5% sequentially to 4.42 billion yuan. The company attributed the increases mainly to greater sales and marketing activity related to new product launches.
Nio Inc Quarterly R&D and SG&A Expenses Q1 2020-Q2 2026 (in million yuan)
Quarter
R&D (RMB mn)
SG&A (RMB mn)
Q1 2020
522
848
Q2 2020
545
937
Q3 2020
591
940
Q4 2020
829
1,207
Q1 2021
687
1,197
Q2 2021
884
1,498
Q3 2021
1,193
1,825
Q4 2021
1,829
2,358
Q1 2022
1,762
2,015
Q2 2022
2,149
2,282
Q3 2022
2,945
2,712
Q4 2022
3,981
3,527
Q1 2023
3,076
2,446
Q2 2023
3,345
2,857
Q3 2023
3,039
3,609
Q4 2023
3,972
3,973
Q1 2024
2,864
2,997
Q2 2024
3,219
3,757
Q3 2024
3,319
4,109
Q4 2024
3,636
4,878
Q1 2025
3,181
4,401
Q2 2025
3,007
3,965
Q3 2025
2,391
4,185
Q4 2025
2,026
3,537
Q1 2026
1,885
3,497
Q2 2026
2,145
4,425
Nio R&D, SG&A expenses in million yuan
R&D
SG&A
As of June 30, Nio held 56.7 billion yuan in cash and cash equivalents, restricted cash, short-term investments and long-term time deposits, up from 48.2 billion yuan at the end of March.
Looking ahead, Nio expects to deliver between 108,000 and 111,000 vehicles in the third quarter, representing year-on-year growth of about 24.0% to 27.5%.
The company expects third-quarter revenue of between 33.285 billion yuan and 34.051 billion yuan, representing year-on-year growth of 52.7% to 56.2%.
Nio delivered 35,934 vehicles in July and 35,836 in August. That means it needs to deliver between 36,230 and 39,230 vehicles in September to meet its third-quarter guidance.
Nio founder, chairman and CEO William Li said all 3 brands — Nio, Onvo and Firefly — recorded growth in both sales volume and average transaction price in the second quarter.
Chief Financial Officer Stanley Qu said strong sales of higher-margin models and continued optimization of the cost structure helped the company maintain healthy margins despite rising cost pressures.
($1 = 6.7809 yuan)
