

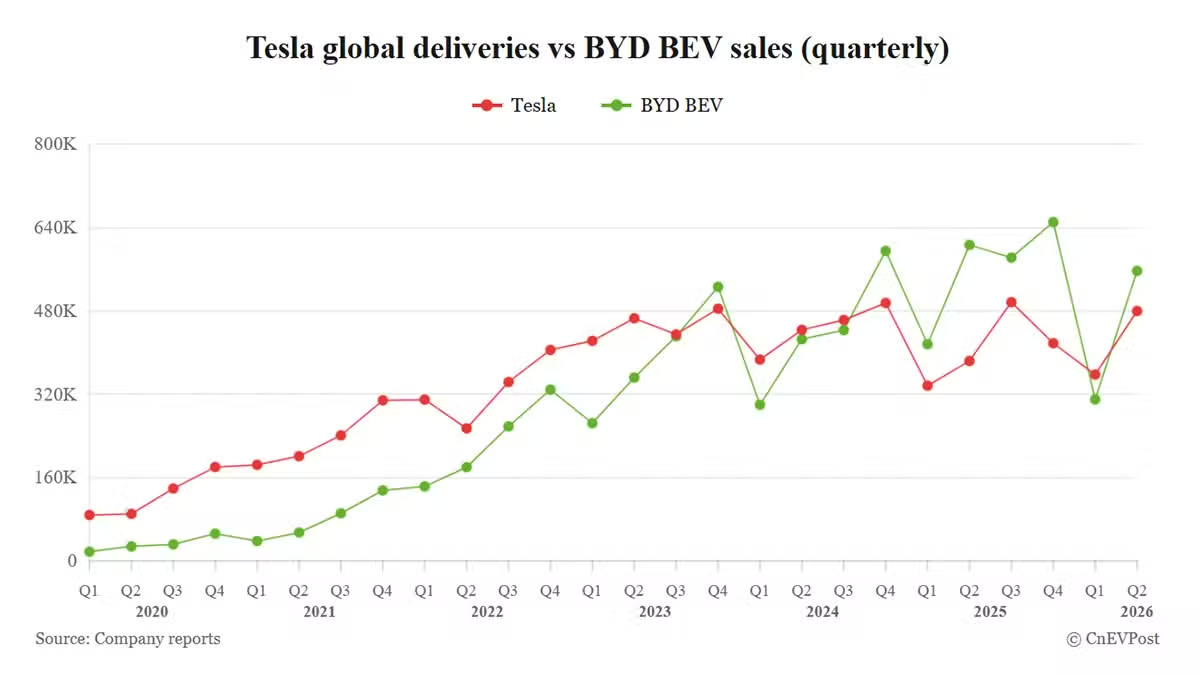
Tesla global deliveries vs BYD BEV sales (quarterly)
Tesla
BYD BEV
Tesla Global Deliveries vs BYD BEV Sales – Quarterly Data
Quarter
Tesla Deliveries
BYD BEV Sales
Q1 2020
88,400
18,110
Q2 2020
90,650
28,151
Q3 2020
139,300
32,088
Q4 2020
180,570
52,621
Q1 2021
184,800
38,599
Q2 2021
201,250
54,841
Q3 2021
241,300
91,684
Q4 2021
308,600
135,686
Q1 2022
310,048
143,223
Q2 2022
254,695
180,296
Q3 2022
343,830
258,610
Q4 2022
405,278
329,011
Q1 2023
422,875
264,647
Q2 2023
466,140
352,163
Q3 2023
435,059
431,603
Q4 2023
484,507
526,409
Q1 2024
386,810
300,114
Q2 2024
443,956
426,039
Q3 2024
462,890
443,426
Q4 2024
495,570
595,413
Q1 2025
336,681
416,388
Q2 2025
384,122
606,993
Q3 2025
497,099
582,522
Q4 2025
418,227
650,811
Q1 2026
358,023
310,389
Q2 2026
480,126
557,090
- BYD sold 557,090 BEVs in the second quarter, about 77,000 units more than Tesla’s 480,126.
- Tesla’s second-quarter deliveries jumped 25% year-on-year, far exceeding analysts’ expectations.
BYD (HKEX: 1211) outsold Tesla (NASDAQ: TSLA) in battery electric vehicles (BEVs) again in the second quarter, even as the US electric vehicle (EV) maker’s deliveries staged a strong rebound.
Tesla announced today that it delivered 480,126 vehicles globally in the second quarter, all of them BEVs.
BYD’s data released yesterday showed it sold 557,090 passenger BEVs in the second quarter, down 8.22% year-on-year, but up 79.48% from 310,389 units in the first quarter.
That means BYD’s BEV sales in the quarter exceeded Tesla’s by 76,964 units, or 16.03%.
In the first quarter, Tesla’s deliveries had overtaken BYD’s BEV sales by about 48,000 units. With BYD’s sales recovering in the second quarter, it reclaimed the quarterly global BEV sales crown.
Notably, the two companies’ BEV sales showed different growth performances in the second quarter. BYD’s BEV sales fell about 8% year-on-year, while Tesla’s surged 25%.
For Tesla, the second quarter marked a clear inflection point. Its deliveries of 480,126 vehicles were up 24.99% year-on-year and up 34.10% from 358,023 in the first quarter.
Tesla Quarterly Global Deliveries 2024-2026
Quarter
2024
2025
2026
Q1
386,810
336,681
358,023
Q2
443,956
384,122
480,126
Q3
462,890
497,099
Q4
495,570
418,227
Tesla quarterly global deliveries
2024
2025
2026
BYD Quarterly Passenger BEV Sales 2024-2026
Quarter
2024
2025
2026
Q1
300,114
416,388
310,389
Q2
426,039
606,993
557,090
Q3
443,426
582,522
Q4
595,413
650,811
BYD quarterly passenger BEV sales
2024
2025
2026
The figure far exceeded Wall Street’s expectations, with analysts’ consensus estimate at 406,024 units.
The quarter was Tesla’s strongest second quarter ever, surpassing the 466,140 vehicles delivered in the second quarter of 2023.
However, it still trailed the all-time record of 497,099 deliveries set in the third quarter of 2025, when US buyers rushed to purchase vehicles before the federal EV tax credit expired on September 30.
Tesla produced 451,758 vehicles in the second quarter, with deliveries exceeding production by about 28,000 units, meaning the company worked down previously accumulated inventory.
That was a reversal from the first quarter, when it built about 50,000 vehicles it could not sell.
In addition, Tesla deployed 13.5 GWh of energy storage products in the second quarter, up more than 40% year-on-year, though slightly below analysts’ expectations of about 13.8 GWh.
In 2025, BYD’s full-year BEV sales reached 2,256,714 units, surpassing Tesla’s 1,636,129 units for the first time to claim the annual global BEV sales crown.
In addition to BEVs, BYD also sells plug-in hybrid electric vehicles (PHEVs). In the first half of this year, BYD’s cumulative passenger BEV sales stood at 867,479 units, still ahead of Tesla’s 838,149.
Tesla will report its second-quarter financial results after the US market close on July 22, and management will hold a conference call that day to discuss the company’s financial and business outlook.
Tesla China’s wholesale volume reached 89,091 units in June, up 24.43% year-on-year, marking the 8th consecutive month of growth.
